Three Less Known Trading Indicators Every Trader Should Know
Guest Post by: Colibri Trader
Traders can easily get lost among all the technical indicators available for analysis. That’s why I want to show you not only the most popular indicators, but also shed light on the less known indicators which can make a significant difference to your trading analysis. In this article, three less known trading indicators are presented that every trader should know about – The Commodity Channel Index (CCI), the Momentum and the ATR Indicator.
1) The Commodity Channel Index (CCI)
 The Commodity Channel Index (CCI), developed by Donald Lambert in the eighties, is an oscillating indicator which measures the deviation of the security’s price against its moving average (MA) and the normal deviation of the moving average. Despite the name, the CCI indicator can successfully be used with various security types like stocks, currencies and indices. As it measures the current price relative to the moving average of the price, CCI increases in value when the price is far above the its average, and decreases in value when the price is far below its average. That’s why CCI can also be used for identifying overbought and oversold conditions.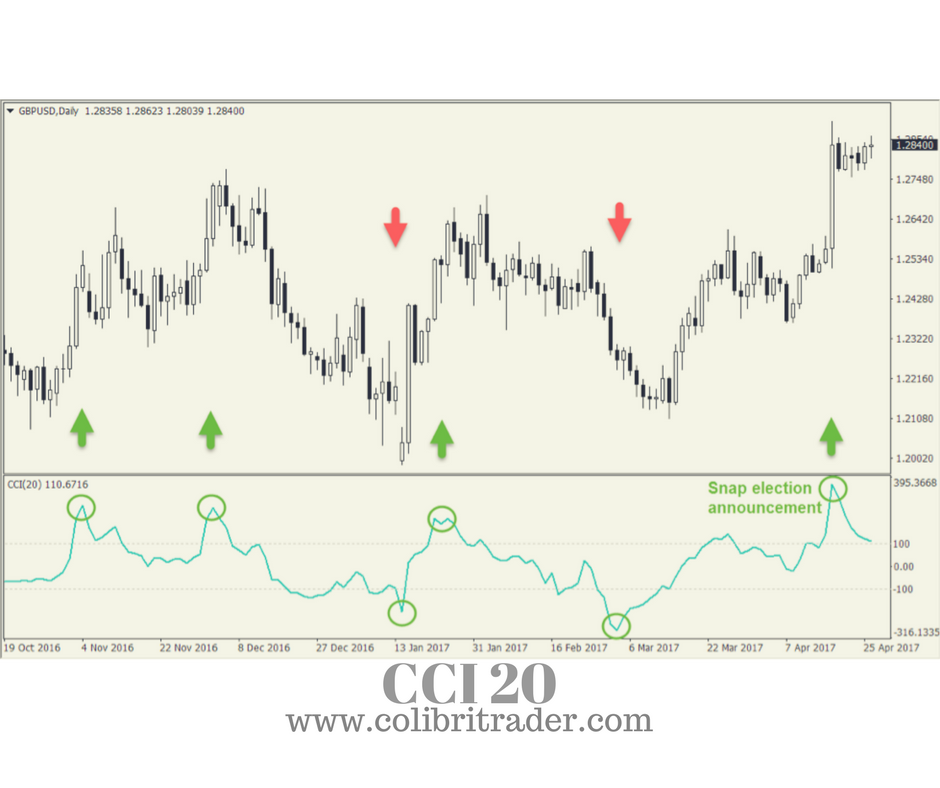
The chart above shows the CCI indicator plotted below the GBP/USD daily chart. It uses a 20-day period which a common period used with the CCI. This means that each new calculation is based on the 20 most recent days for calculating the average price of the pair. Other common periods used in conjunction with CCI are 30 and 40, which generate a less volatile indicator to price changes. The longer the periods, the less often the value of CCI will move outside -100 and +100.
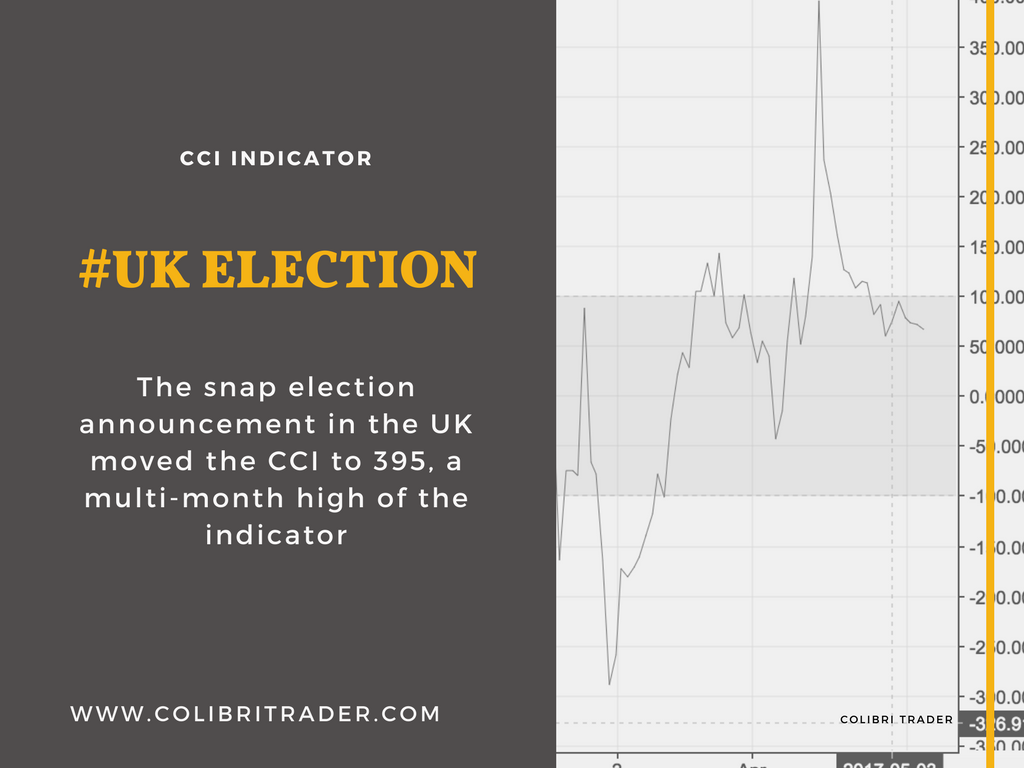
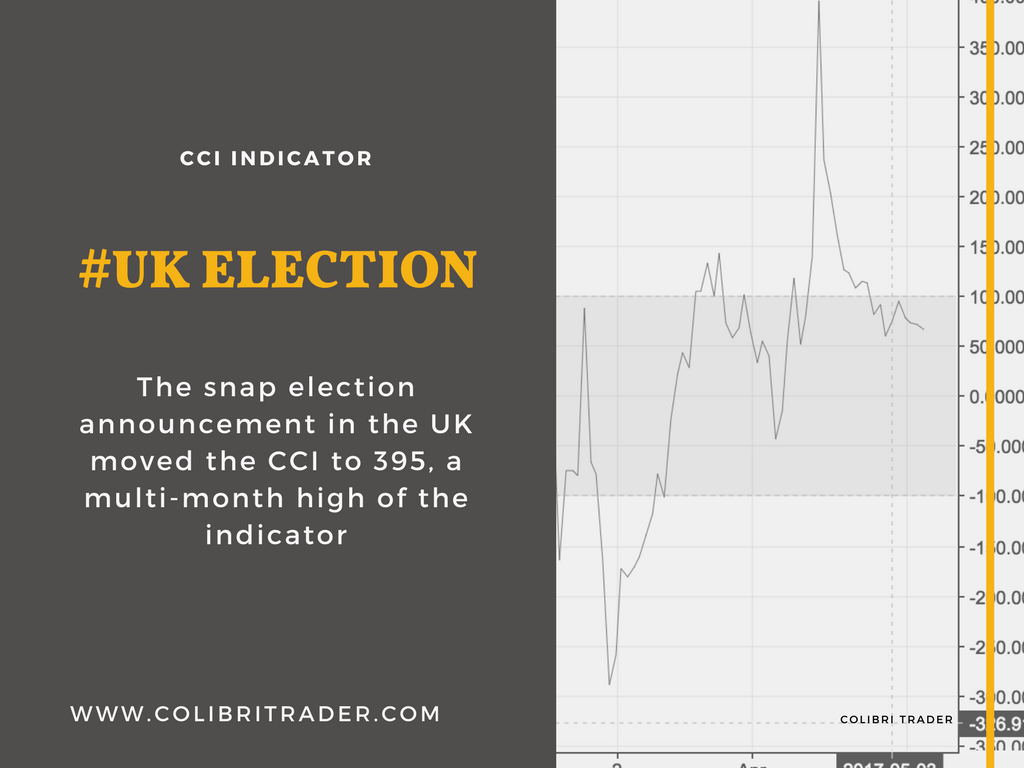
Notice how the CCI remains for most of the time inside the -100 and +100 range in the chart. Lambert used a constant of 0.015 in the CCI calculation to ensure the indicator falls between this range 75% of the time. Values higher than +100 and lower than -100 are showing extreme strength or weakness in the market. The snap election announcement in the UK moved the CCI to 395, a multi-month high of the indicator for the GBP/USD chart.
- Tip: The most common CCI strategy is to enter long positions when the CCI moves above +100, indicating a strong move up in the price, and to enter short positions when the indicator moves below -100.
2) Momentum Indicator
 The Momentum indicator is a simple technical indicator of the oscillator family, which compares the most recent closing price to a single previous closing price. It shows where the present trading price is in relation to a price in previous sessions.
The previous closing price is determined by the indicator’s setting, for example a 10-period Momentum indicator compares the present closing price with the closing price 10 periods ago.Hence, if the closing price of the most recent period is higher than n-periods ago, the value of the indicator will be positive. If the most recent closing price is lower, the Momentum indicator will be negative.
- Hint: There are two versions of the indicator: the first one shows the difference of closing prices in absolute terms, and the second shows the difference in percentage terms.
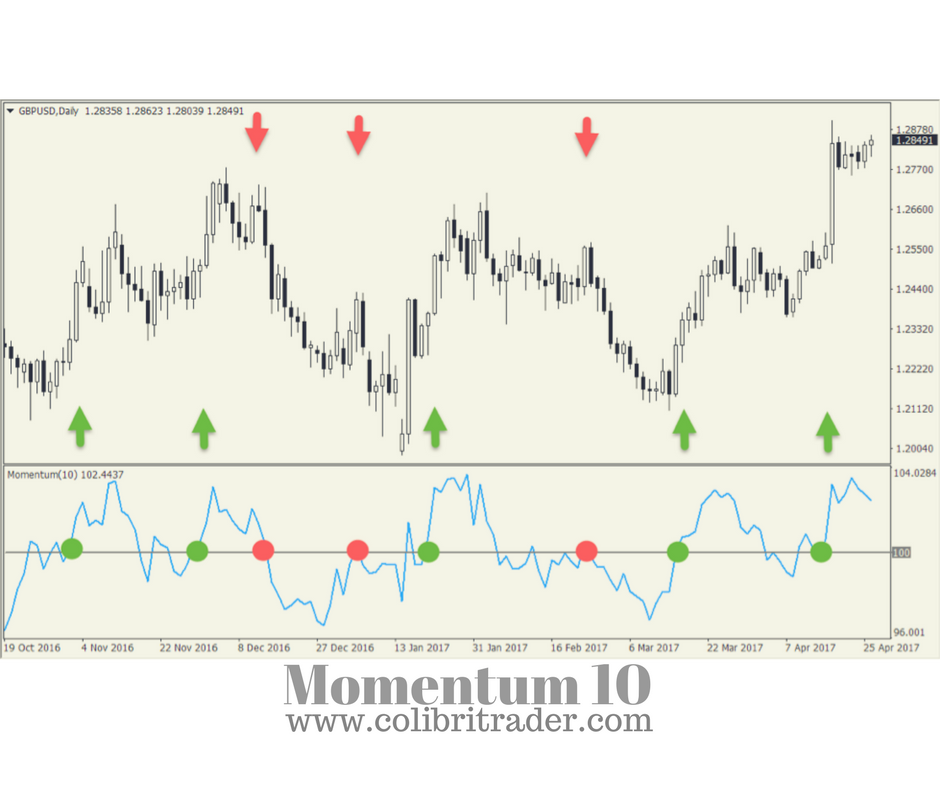
The chart above shows the Momentum indicator on the same GBP/USD pair used for previous examples, so traders can compare the difference in indicator values. The used setting is a 10-period indicator, which in this case means the recent closing price is compared to the closing price 10 days ago.
- Important: If the recent closing price is higher than the one compared, the Momentum indicator will move above the zero-line (which is plotted at the value of 100). If the recent closing price is lower than the closing price 10 days ago, the indicator will move below 100. The greater the compared difference between the closing prices, the greater the distance will be from the zero-line.
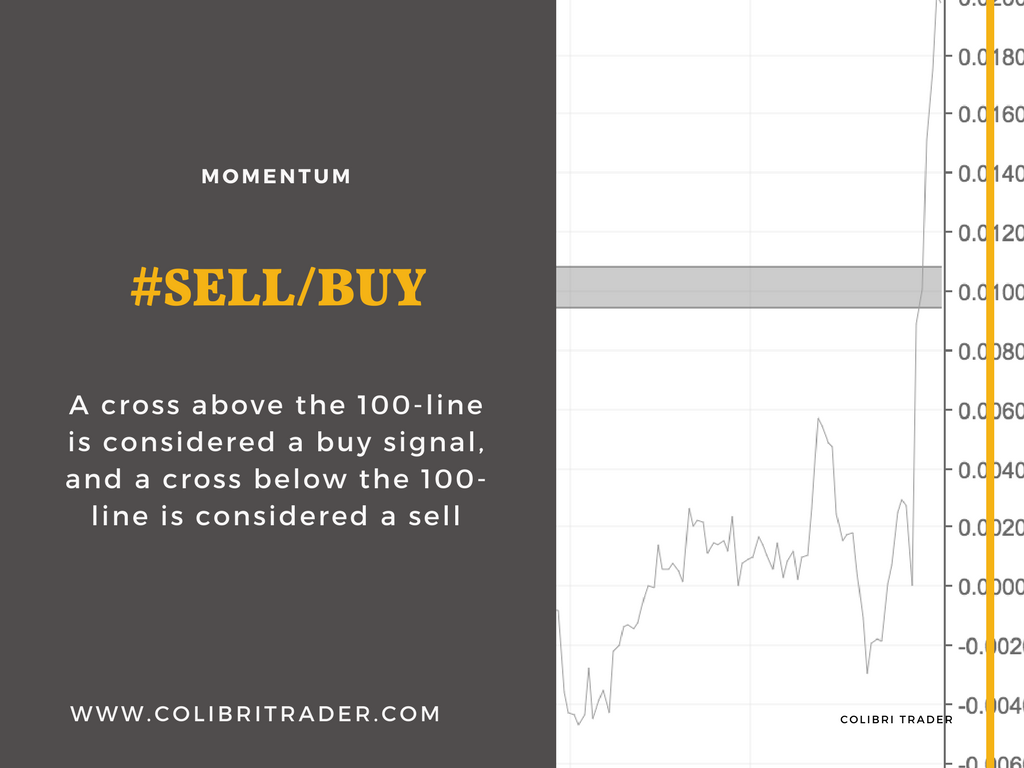
- Hint: A simple trading strategy based on the Momentum indicator is the zero-line crossover. A cross above the 100-line is considered a buy signal, and a cross below the 100-line is considered a sell signal.
Usually, much of the price move will already happen when the indicator crosses the zero-line. False signals also appear often with the Momentum indicator. To prevent these drawbacks, it is possible to add a moving average of the indicator and to buy when the indicator crosses the MA from below, and sell when it crosses from above.
3) The ATR Indicator
Like the CCI indicator, the Average True Range(Check out the full article on ATR) was originally developed for commodities, but is also widely used for stocks, currencies, ETFs and other securities. The ATR indicator measures the price volatility of previous highs and lows in absolute terms. The recommended ATR setting is 14-periods on a daily time-frame. Generally, the ATR will have higher values for more volatile instruments with broader price movements. Contrary, a lower ATR value means the price is moving mostly sideways. The ATR can also be used as a confirmation for bullish or bearish reversals. A growing ATR value in the beginning of a reversal might be used as a confirmation signal, as it shows rising momentum of long or short positions.
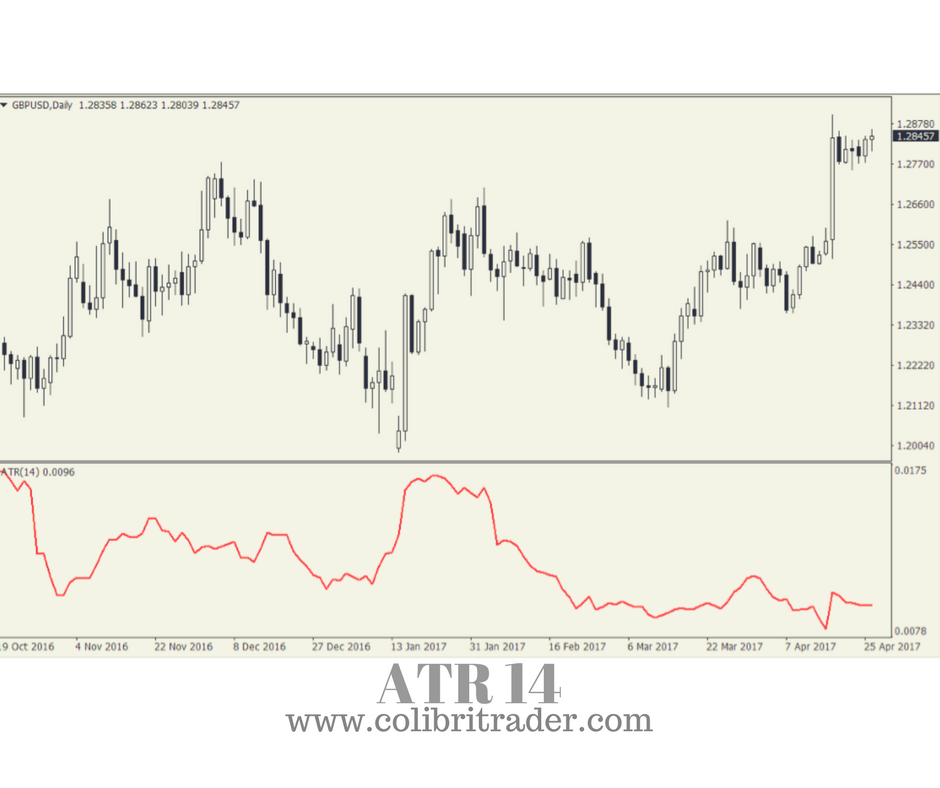
This chart shows the ATR indicator on the GBP/USD pair. As it is a volatility indicator, it doesn’t provide the information where the price is heading. Therefore, its primary use is for assessing the recent volatility change of a security or currency pair. Although ATR does not consider the price direction of the instrument, it can be useful for spotting potential reversals.
- Tip: Higher ATR readings can be followed by reversals, as underlying momentum is building up. But traders need to use additional signals to confirm the reversal.
Another popular use of the ATR is for assessing the required exit level in terms of underlying volatility. A simple volatility ratio can be calculated by dividing the current ATR reading with the current price. A relative higher volatility ratio would require a wider stop-loss, as the price makes greater up and down moves. A ratio is used because higher priced instruments have a greater impact on the ATR value than lower priced ones, which makes comparing ATRs between different-priced instruments impossible.